I am a visual learner. I'm glad my daughter is a visual learner, too. When I finally figure out how to do her math homework, I might be able to explain it in a way that makes sense to the both of us.
Visual learning can take place in governance too. For example, In Trust has written quite a bit about the value of dashboards for governance. Dashboard is a good metaphor — very visual — and many schools have taken the idea to heart, creating systems that gather critical information in one place so that seminary leaders can quickly assess the health of their school.
The dashboard of a car can tell you a lot — fuel level, speed, air temperature, tire pressure. The one thing it can’t tell you is where you’re going. For that we need another metaphor. Randall Basinger, provost at Messiah College, has just the thing: GPS, or governance positioning system.
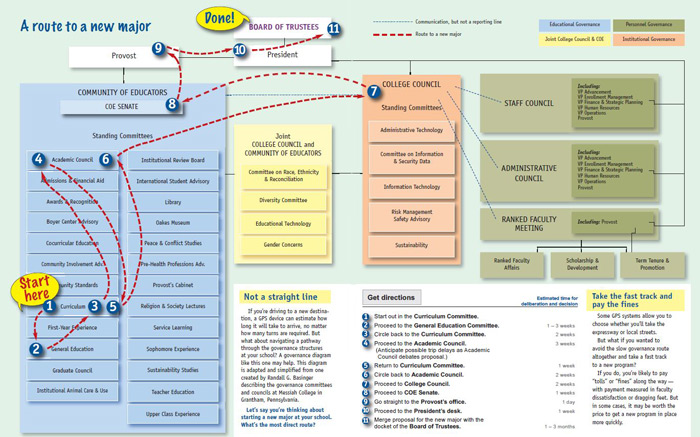
In an article that appeared in the Spring 2012 issue of In Trust, “A clearer view,” Basinger imagined for us a digital tool for “guiding the faculty, president, and board through the apparent morass called shared governance.” This gadget would not only walk someone through the process of seeing certain projects from start to finish, but it might even prioritize tasks by deadlines and complexity.
 Alas, no spry young start-up genius has jumped on the idea since Basinger proposed it in the pages of In Trust. But no matter — he offered an elegant solution: a color-coded governance diagram. It looks a lot like an org chart, with a focus on offices and roles.
I can imagine myself using such a tool, preferably laminated. Then with a dry erase marker, I could easily map out a course to illustrate the route a certain strategy needs to follow to be implemented. In particular, Basinger found it useful to help members of the board’s Education Committee see how decisions move through the corridors of governance.
Click on the image for a PDF of the visual, and read the article for more on how to use this handy tool.