This is the first in a series of articles to assist trustees and administrators in understanding the rapidly changing theological education environment. The article builds on the work of the Association of Theological Schools in the United States and Canada (ATS), and it includes aggregate data submitted by member institutions to ATS.
What should we do? Educational programs, delivery systems, financial models, and student demographics are changing in unparalleled ways. For board members and senior administrators of seminaries and theological schools, the rapid changes contribute to confusion about decision making, resource allocation, and other facets of governance and strategic leadership.
What should trustees and administrators do? In advance of making tough decisions, leaders may find it helpful to understand the context in which they are working. Four context-related questions to consider are these:
-
What are recent trends that leaders should be aware of?
-
Where do individual seminaries and theological schools fit in?
-
Is each institution’s experience unique?
Every theological school and seminary is a one of kind — no other institution has the same location, tradition, mission, and people. Nevertheless, each is also part of a larger picture. By considering recent research findings and the questions that accompany them, leaders can position their institutions in this big picture and be well prepared for the work ahead.
Characteristics of seminaries and theological schools
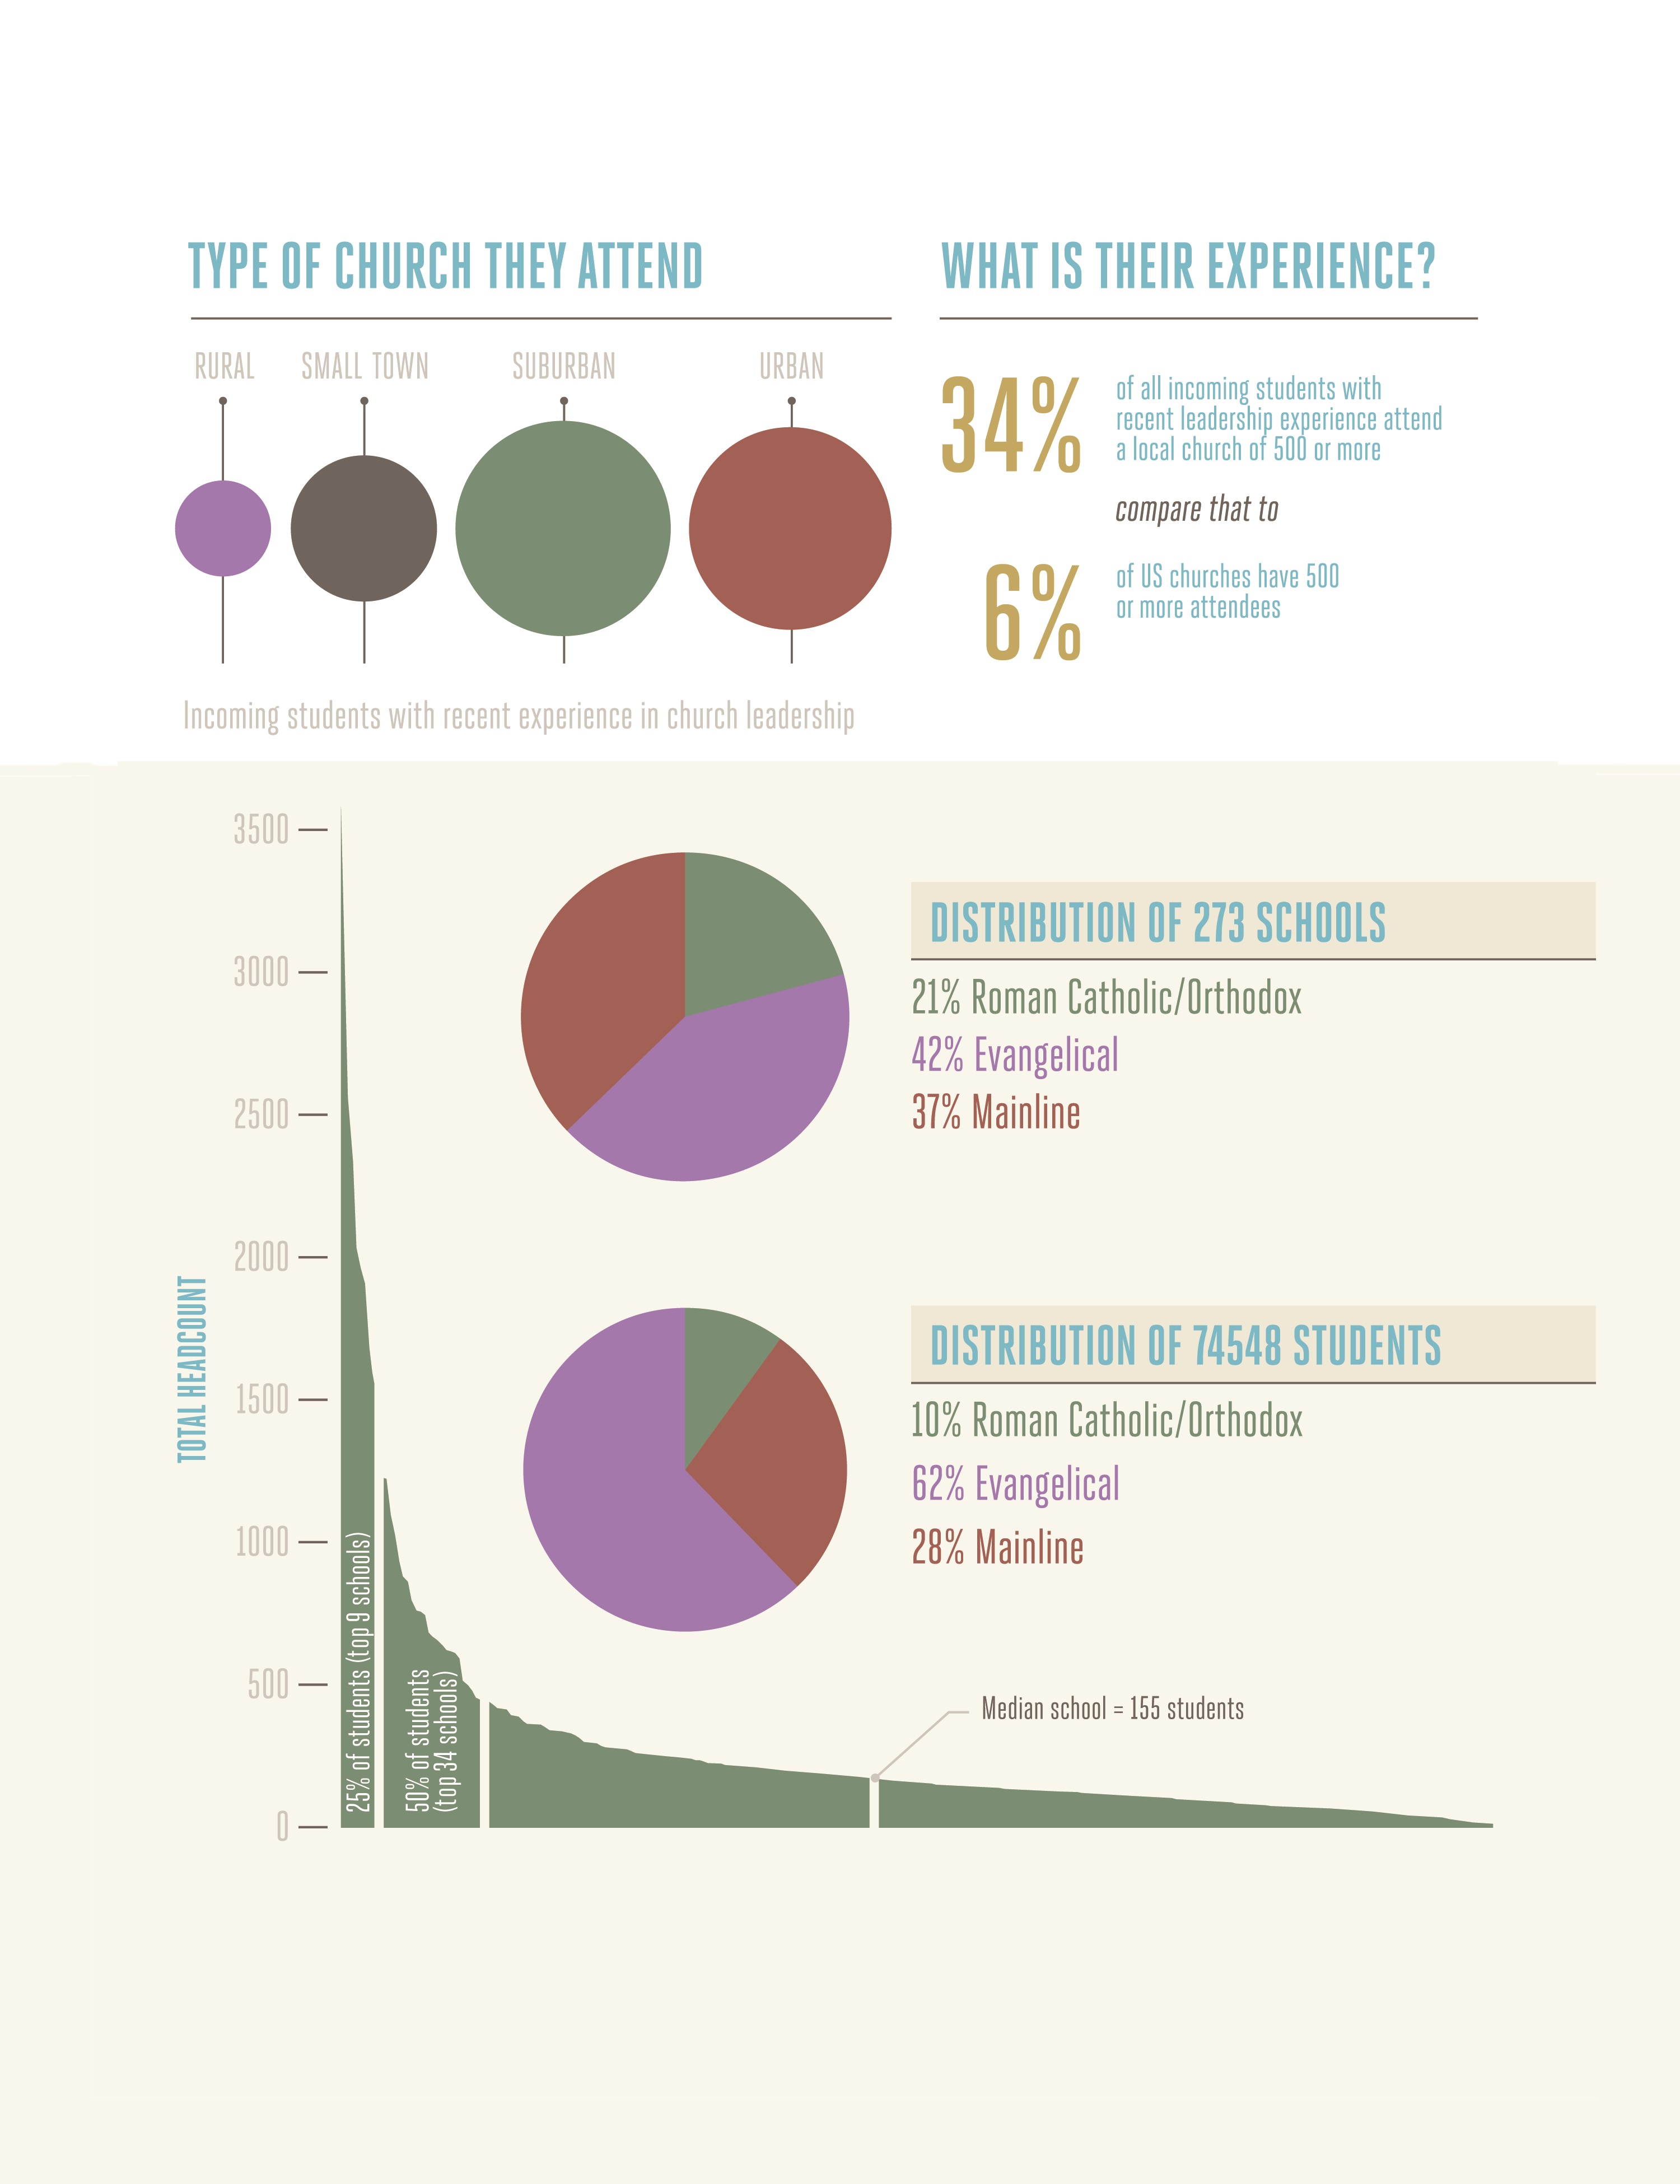
 The Association of Theological Schools (ATS) has a total headcount of 74,548 students in 273 schools (including 240 accredited schools, 10 candidate schools, and 23 associate member schools). To put that in perspective, Arizona State University (ASU) has 73,373 students in its multicampus system. ASU spends about $1.6 billion to educate its students while the schools within ATS collectively spend about $1.8 billion. ATS schools net a collective $466 million in tuition while ASU’s net tuition is around $639 million.
How are theological schools able to operate on fewer tuition dollars? Collectively, they are well endowed. As a whole, ATS schools have $6.95 billion in cash and investments while ASU has only $0.72 billion.
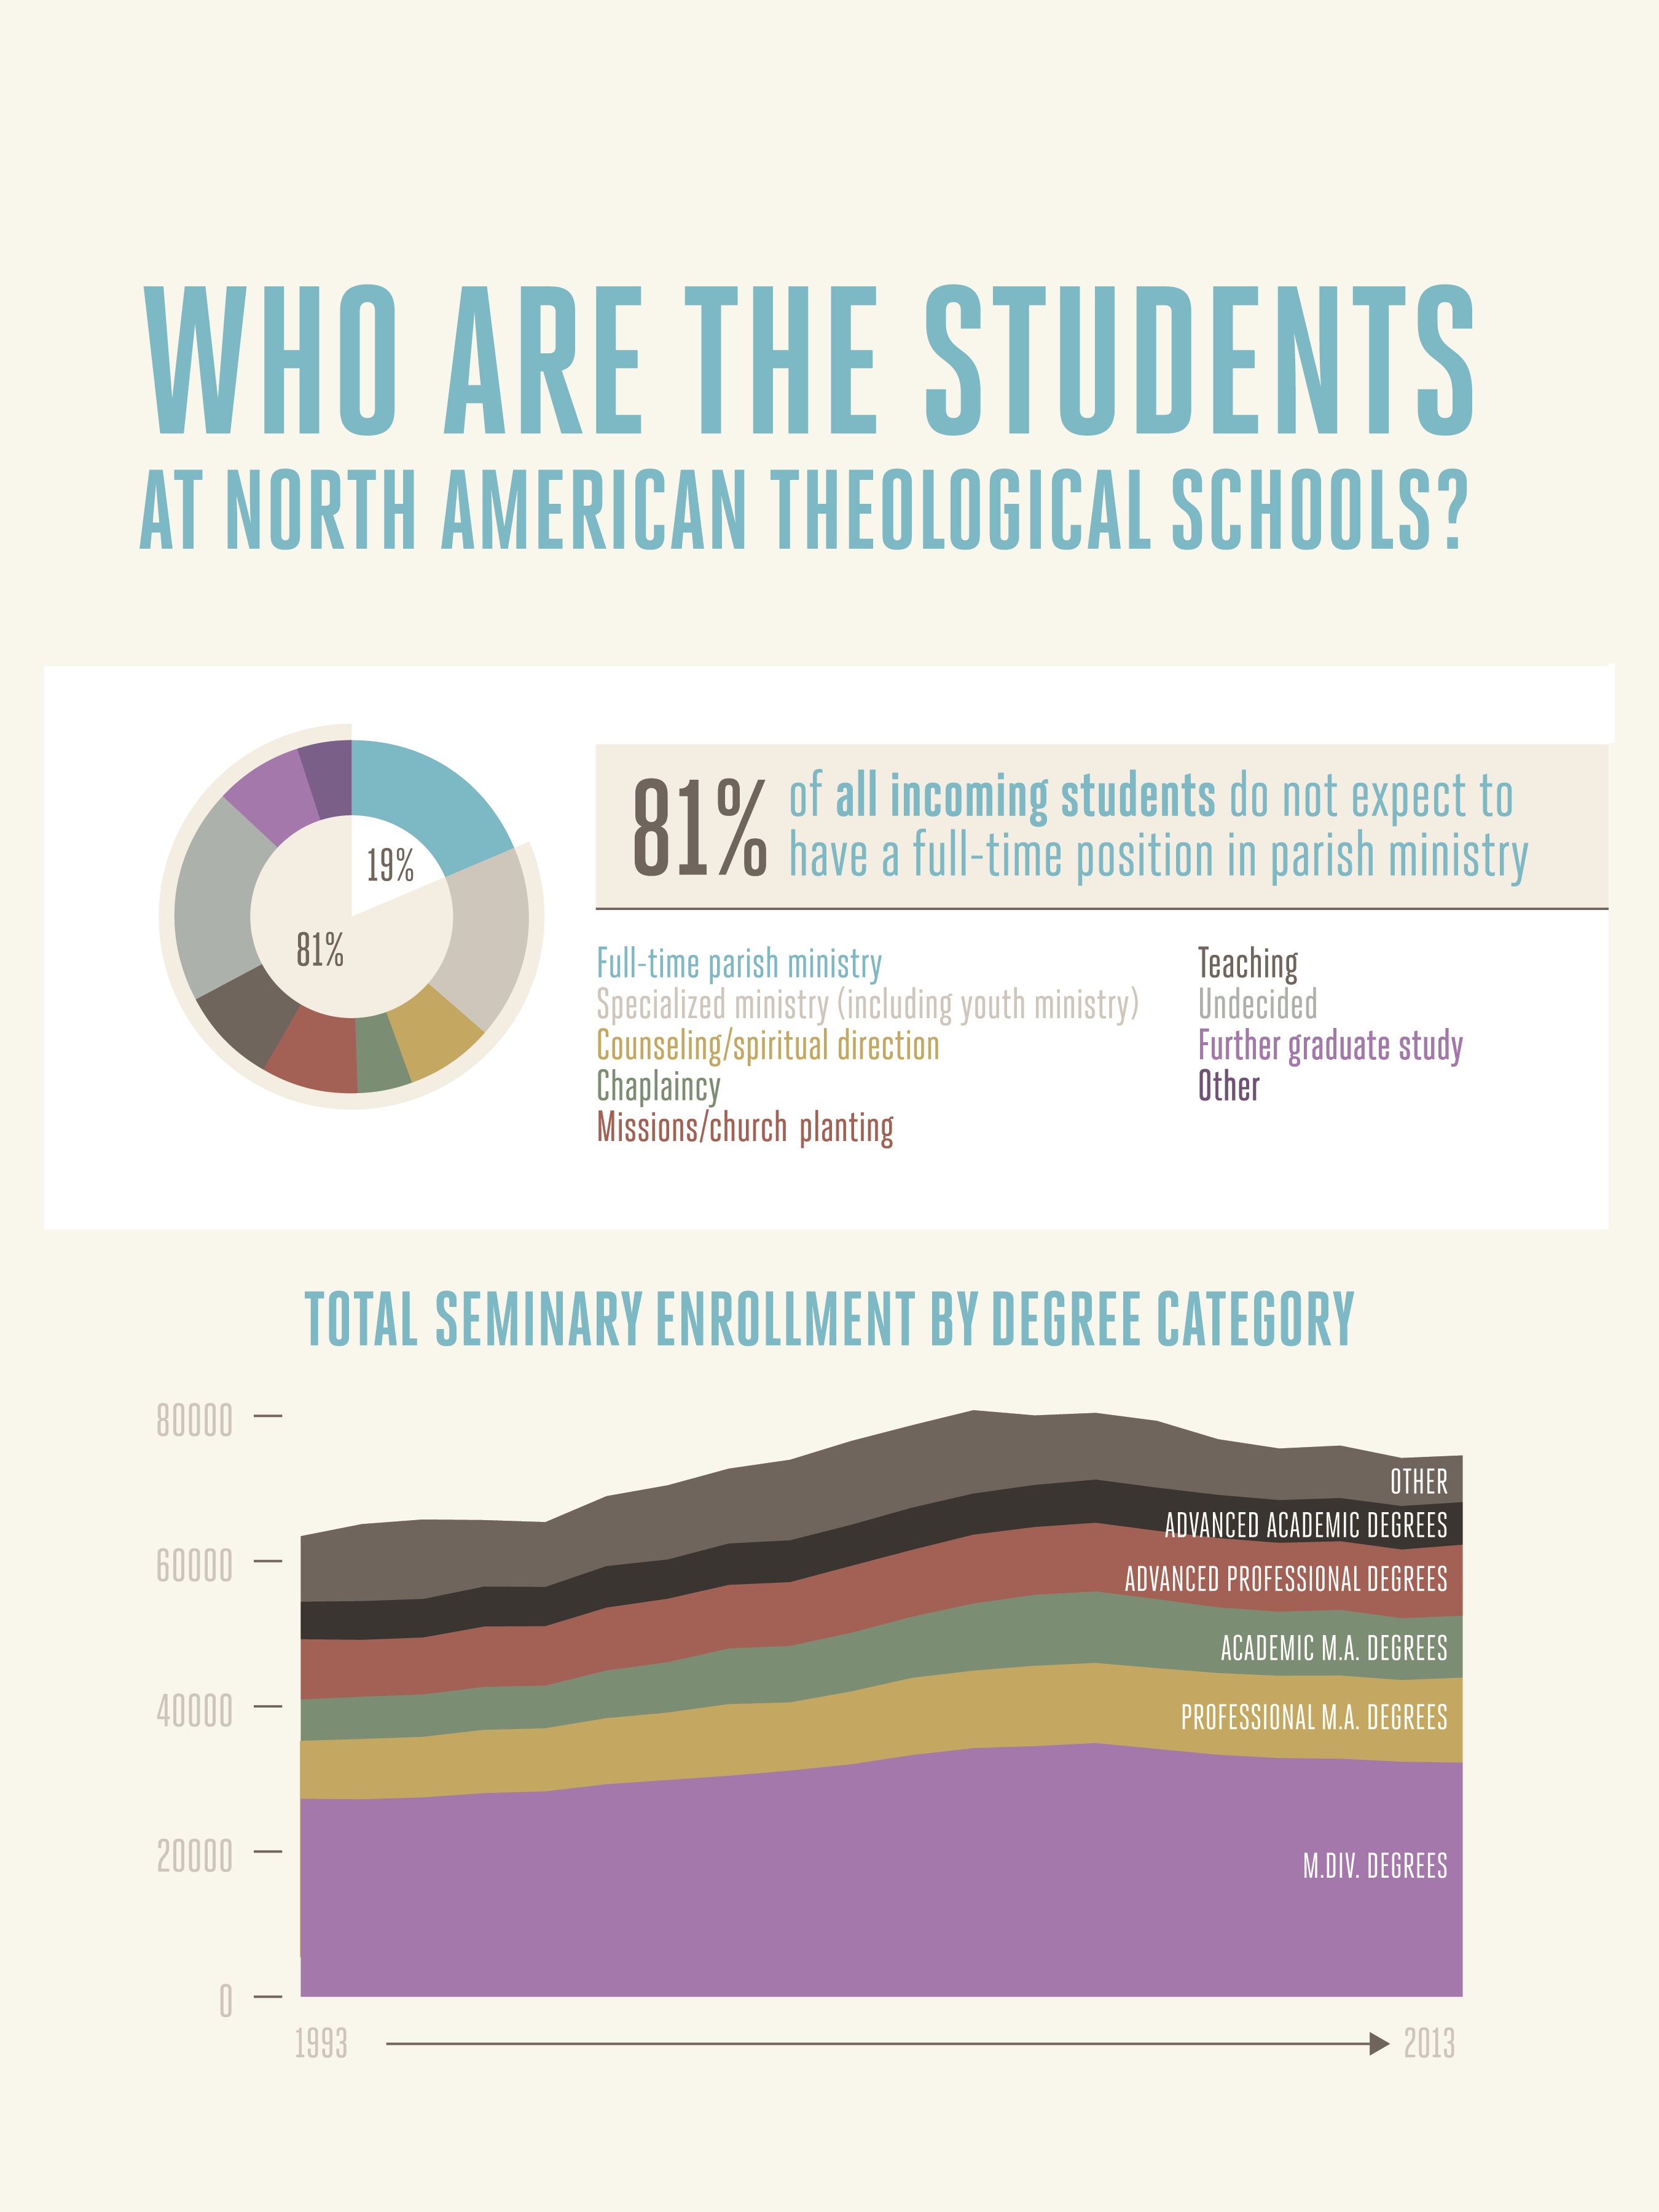
To gain a perspective on ATS enrollment, consider this breakdown of the 74,548 students: From 1993 to 2004, the total enrollment at ATS schools increased by about 1 to 1.5 percent each year; enrollment peaked at 80,000 students in 2004 and has been declining ever since — until 2012. Enrollment grew by a total of 273 students from fall 2011 to fall 2012, but the 2012 numbers included 13 new schools that were added that year. In fact, the overall number of member schools has continued to rise over the years — since 2003, the total number of accredited, candidate, and associate members of ATS has risen by 31 schools.
So, quantitatively speaking, seminaries do not operate in a growth industry. Declining enrollment is spread across a field with more and more institutions.
On the other hand, areas of growth and change reveal qualitative movements that are significant. What are they?
In the past two decades (1993–2012), collective M.Div. enrollment has been flat, but professional M.A. and D.Min. programs are growing. And much of the growth in professional M.A. programs has been at evangelical Protestant schools, which tend to rely more heavily on tuition income than endowment income. This reliance makes them more market driven.
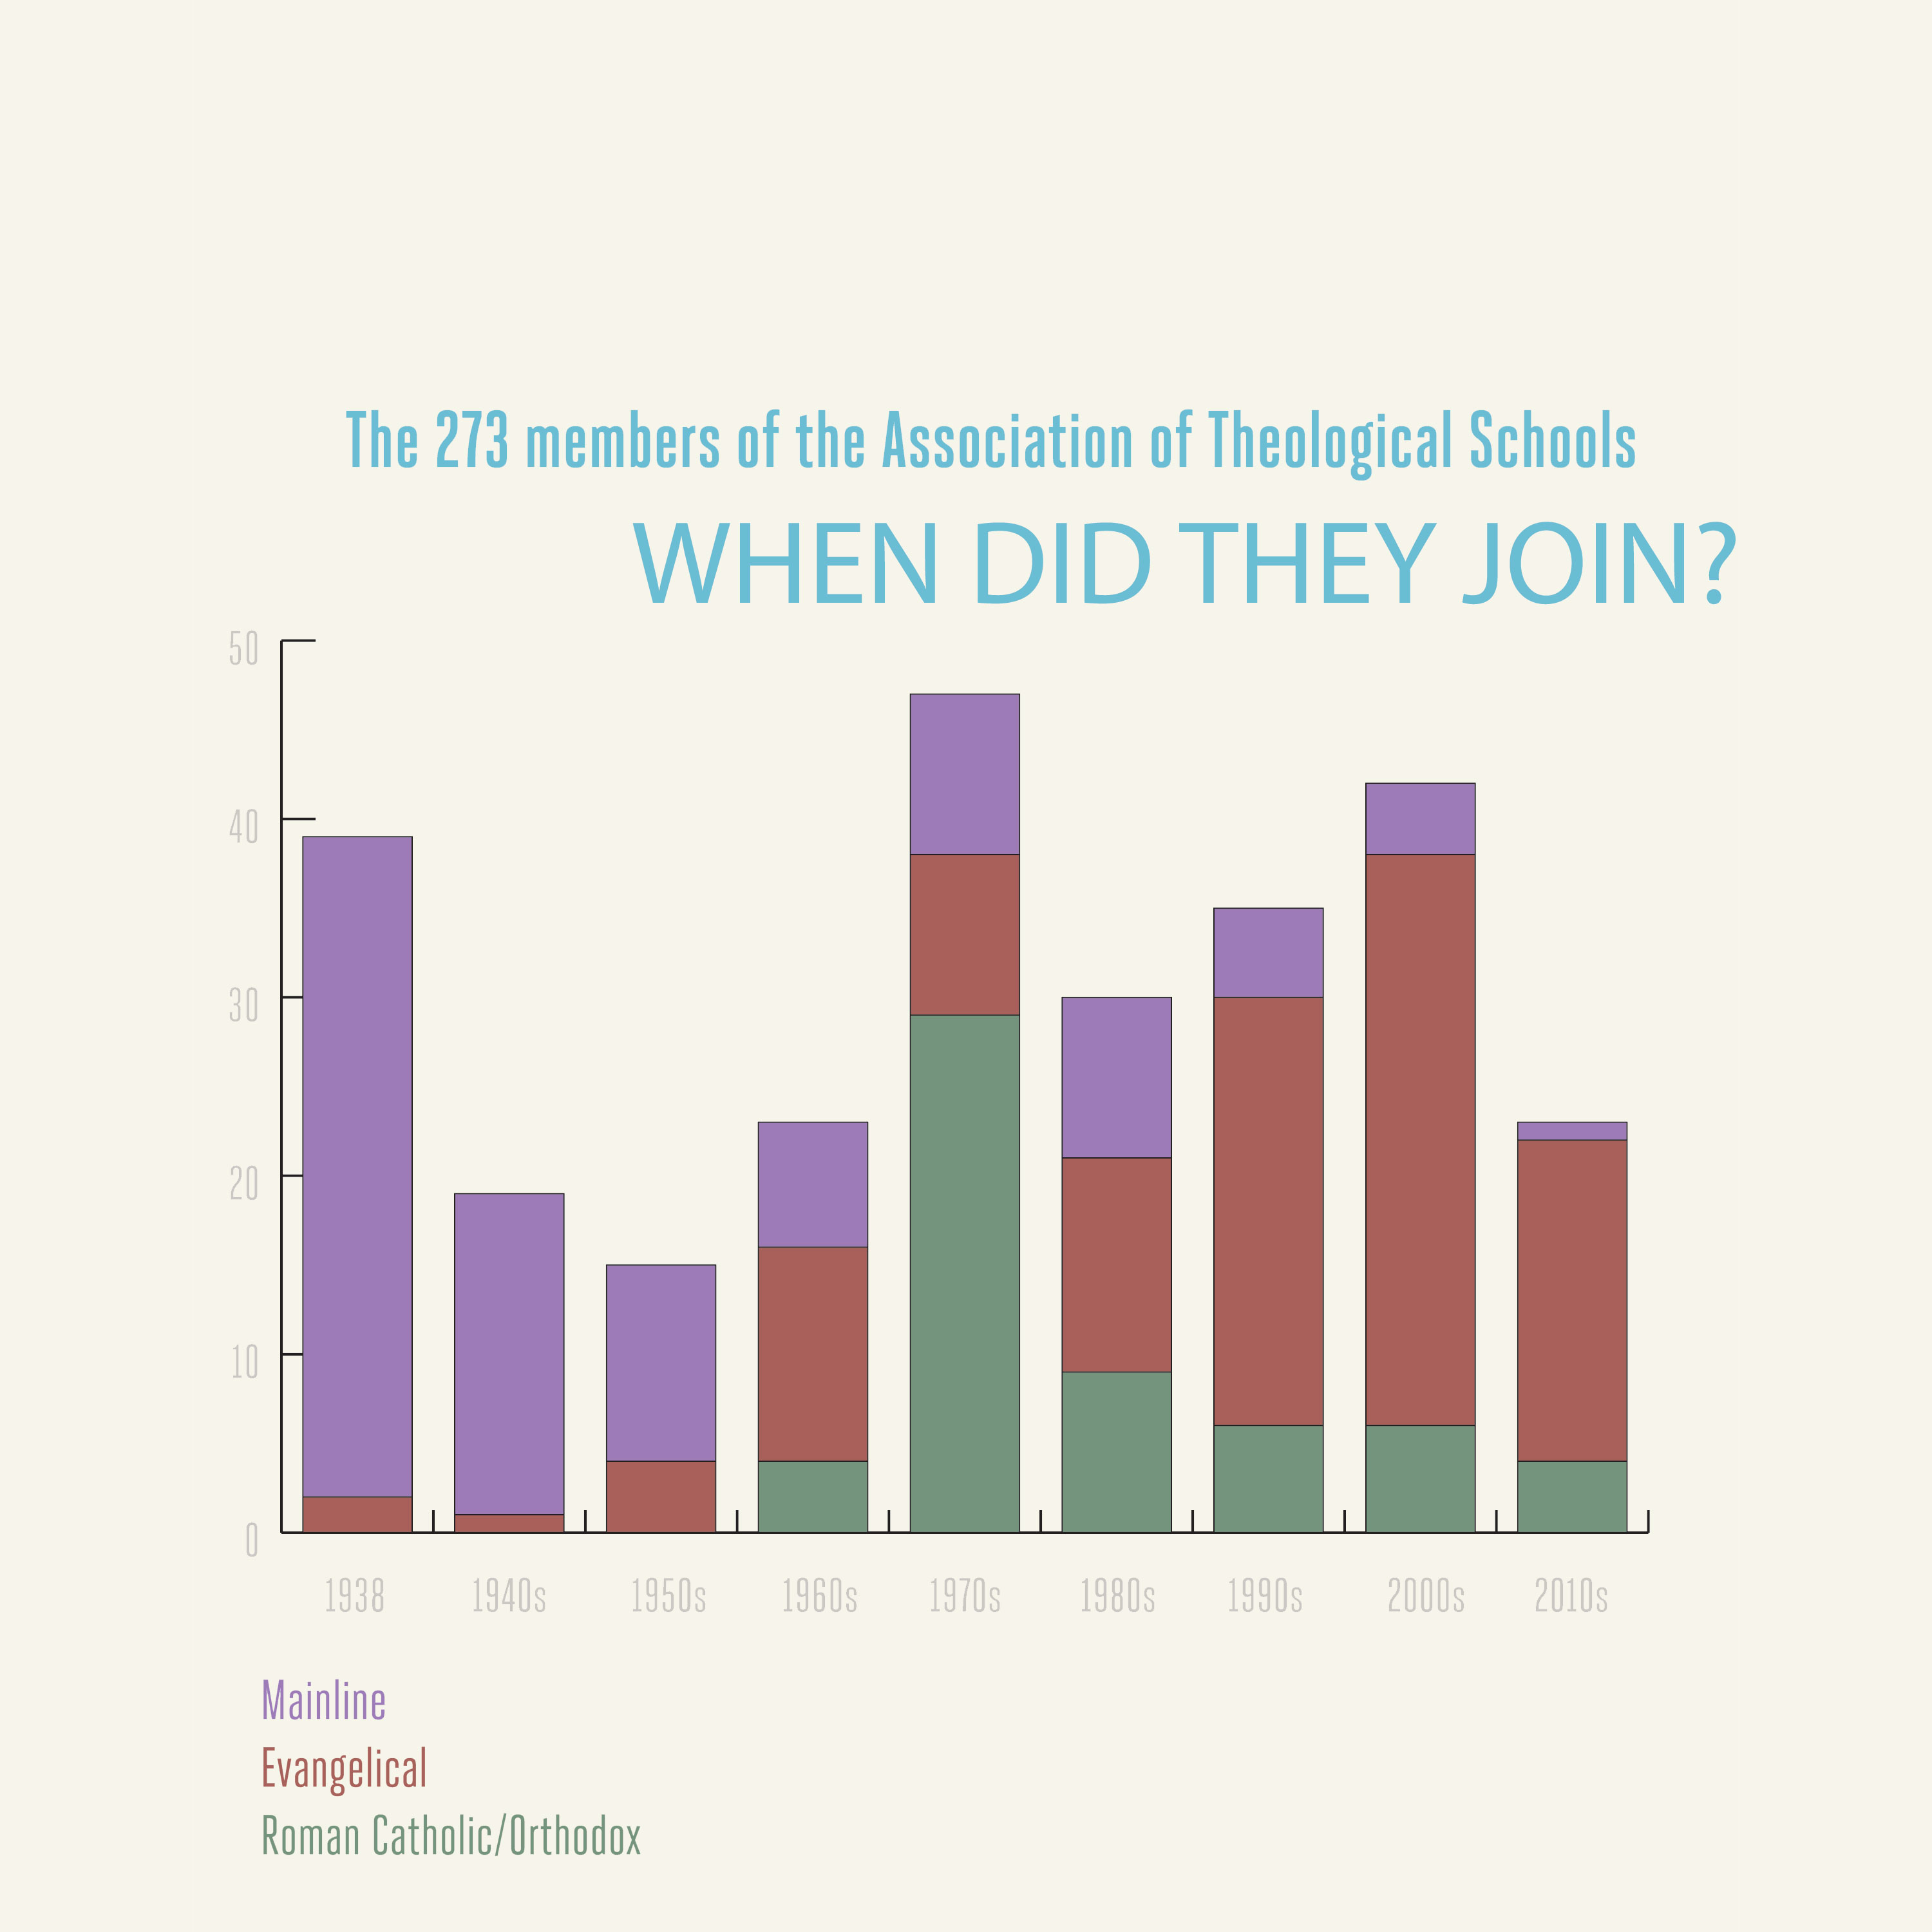
Growth in the M.A and D.Min. degree programs has helped evangelical schools represent the growth sector in the larger context of the ATS, and in fall 2012, evangelical schools for the first time actually outnumbered mainline Protestant schools. At that time, 37 percent of ATS schools were mainline, 21 percent Roman Catholic/Orthodox, and 42 percent evangelical.
Other contributing factors to the growth of the evangelical Protestant sector have been the addition of new schools and the increase in the number of schools embedded in a college or university. In 1993, only 10 percent of all ATS schools were embedded in a college or university. Two decades later, 30 percent of schools within ATS were embedded. Consolidation does not appear as the primary reason for this shift, although freestanding schools do affiliate with colleges from time to time. Rather, the cause simply may be that most of the schools that have joined since 1993 are embedded schools.
Making sense of the data
To understand the implications of these numbers for an individual school, consider this: The median enrollment at an ATS school is 155 students, which means if a school has more than 155 students, it is among the larger ATS institutions.
Enrollment across ATS is somewhat similar to trends in church attendance in the United States. While there are 273 ATS schools, much of the enrollment is concentrated in a relatively small number of them. For example, 25 percent of all students attend the largest nine schools, and 50 percent of all students go to the largest 34 schools. This is because the largest school has about 3,500 students while the smallest has about 10.
It is tempting to assume students are migrating to the larger schools within ATS while the smaller schools are experiencing the decline. In fact, since 2001, schools have seen gains and losses in enrollment regardless of size, type, or ecclesial family.
The median ATS campus has lost about 8 percent of its enrollment since 2001.
As for charitable giving, the 273 ATS schools received $386 million in the 2011–12 academic year, with the median ATS institution receiving about $758,000 in gifts for current operations. The broad distribution witnessed in enrollment also is evident in giving. The top nine schools garnered 25 percent of all giving for current operations among all ATS schools, and the top 34 schools accounted for 50 percent of such giving.
Who are the incoming students?
 To try to answer this question, many seminaries and theological schools annually administer the ATS Entering Student Questionnaire. During the 2012–13 academic year, 6,900 incoming students at 161 programs took the survey. The information that surfaced may shed light on the changes in theological education. Of particular interest are the expectations and prior experiences of incoming students, the vast majority of whom do not expect to have a full-time parish ministry position upon graduation. In fact, fewer than one in five incoming students expect to have such a role.
Have schools lost their focus? To the contrary, seminaries are doing much more than training pastors for the church. They are training men and women for different forms of ministry and service in God’s kingdom. It is important for board members and administrators to understand the wide array of students’ expectations upon entering seminary. Many incoming students are attending with the expressed goal of growing spiritually, finding meaning in life, or searching for a direction in ministry.
Questions that trustees and administrators might ask themselves include:
-
Do we know why our incoming students are attending our institution?
-
What do incoming students expect to gain from their educational experience?
-
Do we have different strategies to reach, retain, and educate students who attend with various goals in mind—to deepen personal spirituality, prepare for further graduate study, or prepare for full-time service or ministry?
-
How closely does the aggregated data about incoming students reflect our own student population?
Many boards and even administrators believe that their seminaries are primarily preparing pastors for the church. But in this era of change, that might be an outdated assumption.
In addition, schools may need to think more about the experiences of students prior to matriculation. Most incoming students find seminary to be nothing like — or at least very different from — their undergraduate experience. For example, fewer than three-tenths of incoming students have an undergraduate degree in religion or theology, and fewer than half attended a religious undergraduate institution. As a result, another set of challenges has emerged: Seminary is both an academic shock and a culture shock.
For board members and senior administrators, there are questions that follow naturally from this data:
-
How do orientation initiatives bring students into the educational experience?
-
Are schools adequately on-boarding students?
-
These programs may have an impact on retention and graduation rates, which in turn affect institutional effectiveness, enrollment, and the bottom line.
Another note regarding the experiences of incoming students is related to church life. Today, 36 percent of incoming M.Div. students attend a church with 500 or more members. On the other hand, only 6 percent of churches in the United States have 500
or more attendees. Data from Duke University researcher Mark Chaves suggest that many incoming M.Div. students come from larger congregations because almost half of all churchgoers attend the largest 10 percent of U.S. congregations. But students from large-church backgrounds may find that their long-term ministry home is in a smaller congregation. Can seminaries add value by helping students navigate this transition? This is an important question for seminary leaders.
So what?
What does all this information mean? Why does it matter? Here are three “next steps” that may help theological educators and board members to internalize some of the research data.
Determine your school’s position. How does your school fit into the larger picture of accredited theological schools? Understanding your place in the universe helps inform your strategic planning processes, staffing decisions, and financial modeling. Industry-wide trends in theological education show that enrollment is declining gradually — how does that affect enrollment and financial planning at your institution?
 ATS provides a great resource through the Institutional Peer Profile Report (IPPR), which offers a comparison between your school and peer institutions that you select. Chris Meinzer (meinzer@ats.edu), senior director of finance and administration at ATS, can help your school create a good list of peer institutions for the IPPR. Then your whole board can profit from reading and discussing it.
Take context into account. As in ministry, the context of a seminary greatly impacts the work of the seminary. A large school in Chicago has a much different context than a large school in North Carolina. It is important for each institution to understand its context, how its mission fits in that context, and what data it needs to make strong decisions. In addition, each school needs solid information about itself. What has enrollment looked like in your institution over the past 5–25 years? Why do students come? What are their backgrounds?
Share your findings. Information like that which we’ve provided in this article is important to faculty, staff, and board members alike. After you have learned where your institution fits and have gained an understanding of your context, share the information with your staff, faculty, and board. Amazing conversations can start!
It is important to note that in 1 Chronicles 12:31, it was not the “leader,” singular, but “leaders,” plural, of Issachar who “understood the times” and knew what God’s people should do. Undoubtedly, these leaders talked about what they saw and then charted the course for God’s people. The purpose of the ATS findings reported here and in the next two issues of In Trust is to serve the leaders at your school in similar fashion. The goal is to help you understand the times.
Read more from Greg Henson on this topic at www.intrust.org/henson.